This is a the third part of a five (5) part blog post on building and using Clustering in Oracle Data Miner. The following outlines the contents of each post in this series on Clustering.
- The first part we looked at what clustering features exist in ODM and how to setup the data that we will be using in the examples
- The second part will focus on how to building Clusters in ODM .
- The third post will focus on examining the clusters produced by ODM and how to use the Clusters to apply to new data using ODM.
- The fourth post will look at how you can build and evaluate a Clustering model using the ODM SQL and PL/SQL functions.
- The fifth and final post will look at how you can apply your Clustering model to new data using the ODM SQL and PL/SQL functions.
In my previous posts on Clustering in ODM we have setup our data, we have explored it, we have taken a sample of the data and used this sample as input to the Cluster Build node. Oracle Data Miner has two clustering algorithms and our Cluster Build node created a clustering model for each.
In this post we will look at the next steps. The first of these is that we will look at examining what clustering models ODM produced. In the second part we will look at how we can use one of these clustering models to apply and label new data.
Step 1 – View the Cluster Models
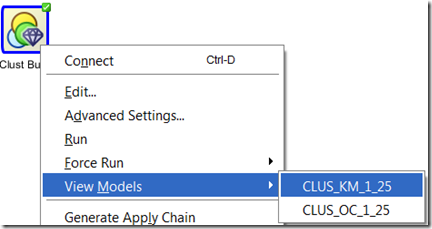
To view the the cluster modes we need to right click the Cluster Build node and select View Models from the drop down list. We get an additional down down menu that gives the names of the two cluster models that were developed.
In my case these are called CLUS_KM_1_25 and CLUS_OC_1_25. You may get different numbers on your model names. These numbers are generated internally in ODM
The first mode that we will look at will be the K-Mean Cluster Model (CLUS_KM_1_25). Select this from the menu.
Step 2 – View the Cluster Rules
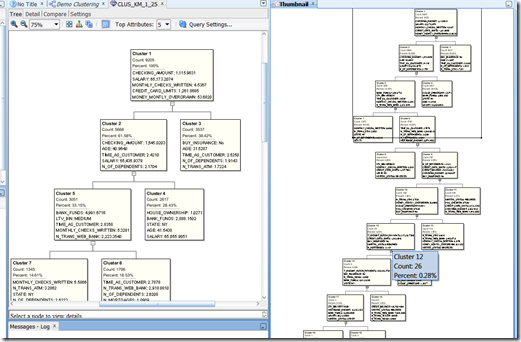
The hierarchical K-Mean cluster mode will be displayed. You might need to readjust/resize some of the worksheets/message panes etc in ODM to get the good portion of the diagram to display.
With ODM you cannot change, alter, merge, split, etc any the clusters that were generated. Oracle take the view of, this is what we have found it it up to you now to decide how you are going to use it.
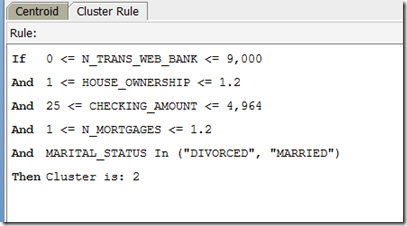
To see that the cluster rules are for each cluster you can click on a cluster. When you do this you should get a pane (under the cluster diagram) that will contain two tabs, Centroid and Cluster Rule.
The Centroid tab provides a list of the attributes that best define the selected cluster, along with the average value for each attribute and some basic statistical information.
The Cluster Rules tab contains a set of rules that define the cluster in a IF/THEN statement format.
For each cluster in the tree we can see the number of cases in each cluster the percentage of overall cases for this cluster.
Work your way down the tree exploring each of the clusters produced.
The further down the tree you go the smaller the percentage of cases will fall into each cluster. In some tools you can merge these clusters. Not so in ODM. What you have to do is to use an IF statement in your code. Something like IF cluster_num IN (16, 17, 18, 19) THEN …..
Step 3 – Compare Clusters
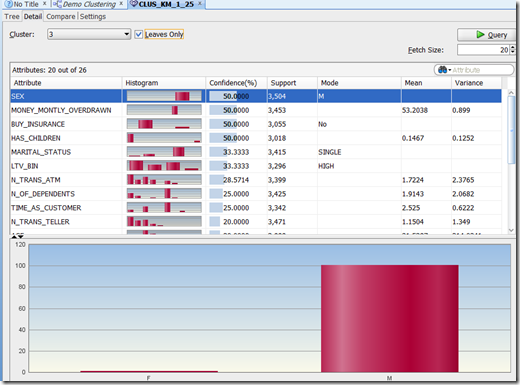
In addition to the cluster tree, ODM also has two addition tabs to allow us to explore the clusters. These are Detail and Compare tabs.
Click on the Detail tab. We now get a detailed screen that contain various statistical information for each attribute. We can for each attribute get a histogram of the values within each attribute for this cluster.
We can use this important to start building up a picture of what each cluster might represent based on the values (and their distribution) for each cluster.
Try this out for a few clusters.
Step 4 – Multi-Cluster - Multi-variable Comparison of Clusters
The next level of comparison and evaluation of the clusters can be found under the Compare tab.
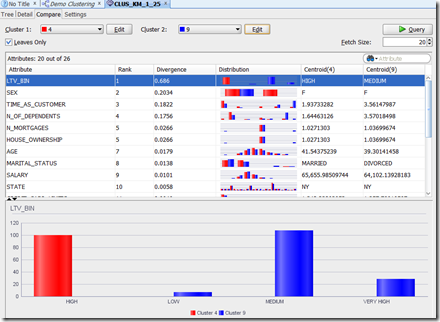
This lets us compare two clusters against each other at an attribute level. For example let us compare cluster 4 and 9. The attribute and graphics section gets updated to reflect the data for each of cluster. These are colour coded to distinguish the two clusters.
We can work our way down through each attribute and again we can use this information to help us to understand what each cluster might represent.
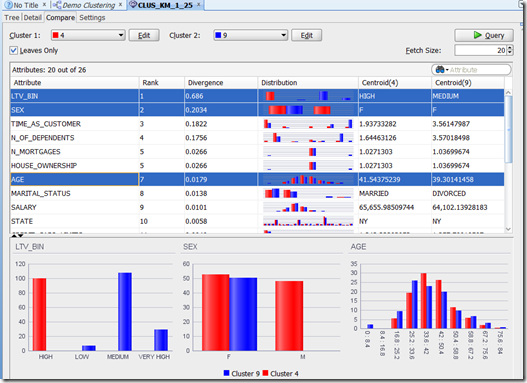
An additional feature here is that we can do multi-variable (attribute) comparison. Holding down the control button select LTV_BIN, SEX and AGE. With each selection we get a new graph appearing at the bottom of the screen. This shows the distribution of the values by attribute for each cluster. We can learn a lot from this.
So one possible conclusion we could draw from this data would be that Cluster 4 could be ‘Short Term Value Customers’ and Cluster 9 could be ‘Long Term Value Customer’
Step 5 – Renaming Clusters
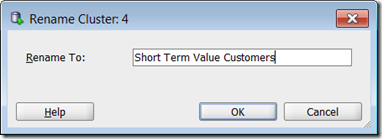
When you have discovered a possible meaning for a Cluster, you can give it a meaningful name instead of it having a number. In our example, we would like to re-label Cluster 4 to ‘Short Term Value Customers’. To do this click on the Edit button that is beside the drop down that has cluster 4. Enter the new label and click OK.
In the drop down we will now get the new label appearing instead of the cluster number.
Similarly we can do this for the other cluster e.g. ‘Long Term Value Customer’.
We have just looked at how to explore our K-Means model. You can do similar exploration of the O-Cluster model. I’ll leave that for you to do.
We have now explored our clusters and we have decided which of our Clustering Models best suits our needs. In our scenario we are going to select the K-Mean model to apply and label our new data.
Step 1 – Create the Apply Node
We have already setup our sample of data that we are going to use as our Apply Data Set. We did this when we setup the two different Sample node.
We are going to use the Sample node that was set to 40%.
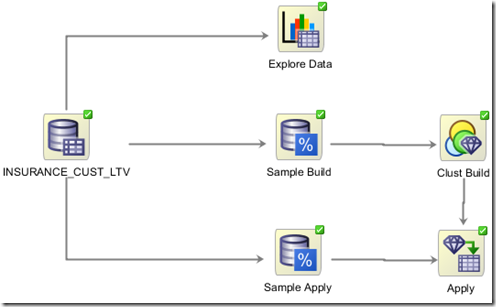
The first step requires us to create an Apply Node. This can be found under the Component Palette and Evaluate and Apply tab. Click on the Apply node and move the mouse to the workflow worksheet and click near the Sample Apply node.
To connect the two nodes, move the mouse to the Sample Apply node and right click. Select Connect from the drop down menu and then move the mouse to the Apply node and click again. An connection arrow will be created joining these nodes.
Step 2 – Specify which Clustering Model to use & Output Data
Next we need to specify which of the clustering model we want to use to apply to our new data.
We need to connect the Cluster Build node to the Apply node. Move the mouse to the Cluster Build node, right click and select connect from the drop down menu. Move the mouse to the Apply node and click. We get the connection arrow between the two node.
We now have joined the Data and the Cluster Build node to the Apply node.
The final step is to specify what clustering mode we would like to use. In our scenario we are going to specify the K-Mean model.
(Single) Click the Cluster Build node. We now need to use the Property Inspector to select the K-Means model for the apply set. In the Models tab of the Property Inspector we should have our two cluster models listed. Under the Output column click in the box for the O-Cluster model. We should now get a little red X mark appearing. The K-Mean model should still have the green arrow under the Output column.
Step 3 – Run the Apply Node
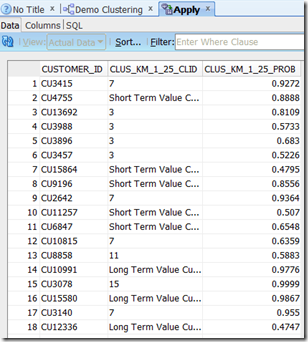
We have one last data setup to do on the Apply node. We need to specify what data from the apply data set we want to include in the output from the Apply node. For simplicity we want to just include the primary key, but you could include all the attributes. In addition to including the attributes from the apply data source, the Apply Node will also create some attributes based on the Cluster model we selected. In our scenario, the K-Means model will create two additional attributes. One of these will contain the Cluster ID and the other attribute will be the probability of the that cluster being valid.
To include the attributes from the source data, double click on the Apply node. This will open the Edit Apply Node window. You will see that it already contains the two attributes that will be created by the K-Mean model.
To add the attributes from the source data, click on the Data Columns tab and then click on the green ‘+’ symbol. For simplicity we are going to just select the CUSTOMER_ID. Click the OK button to finish.
Now we are ready to run the Apply node. To do this right click on the Apply Node and select Run from the drop down menu. When everything is finished you will get the little green tick mark on the top right hand corner of the Apply node.
Step 4 – View the Results
To view the results and the output produced by the Apply node, right click on the Apply node and select View Data from the drop down menu.
We get a new tab opened in SQL Developer that will contain the data. This will consist of the CUSTOMER_ID, the K-means Cluster ID and the Cluster Probability. You will see that the some of the clusters assigned will have a number and some will have the cluster labels that we assigned in a previous step.
It is now up to you to decide how you are going to use this clustering information in an operational or strategic way in your organisation.
In my next (fourth) blog post in the series on Clustering in Oracle Data Miner, I will show how you can perform similar steps, of building and evaluating clustering models, using the SQL and PL/SQL functions in the database. So we will not be using the ODM tool. We will be doing everything in SQL and SQL/PLSQL.





No comments:
Post a Comment